
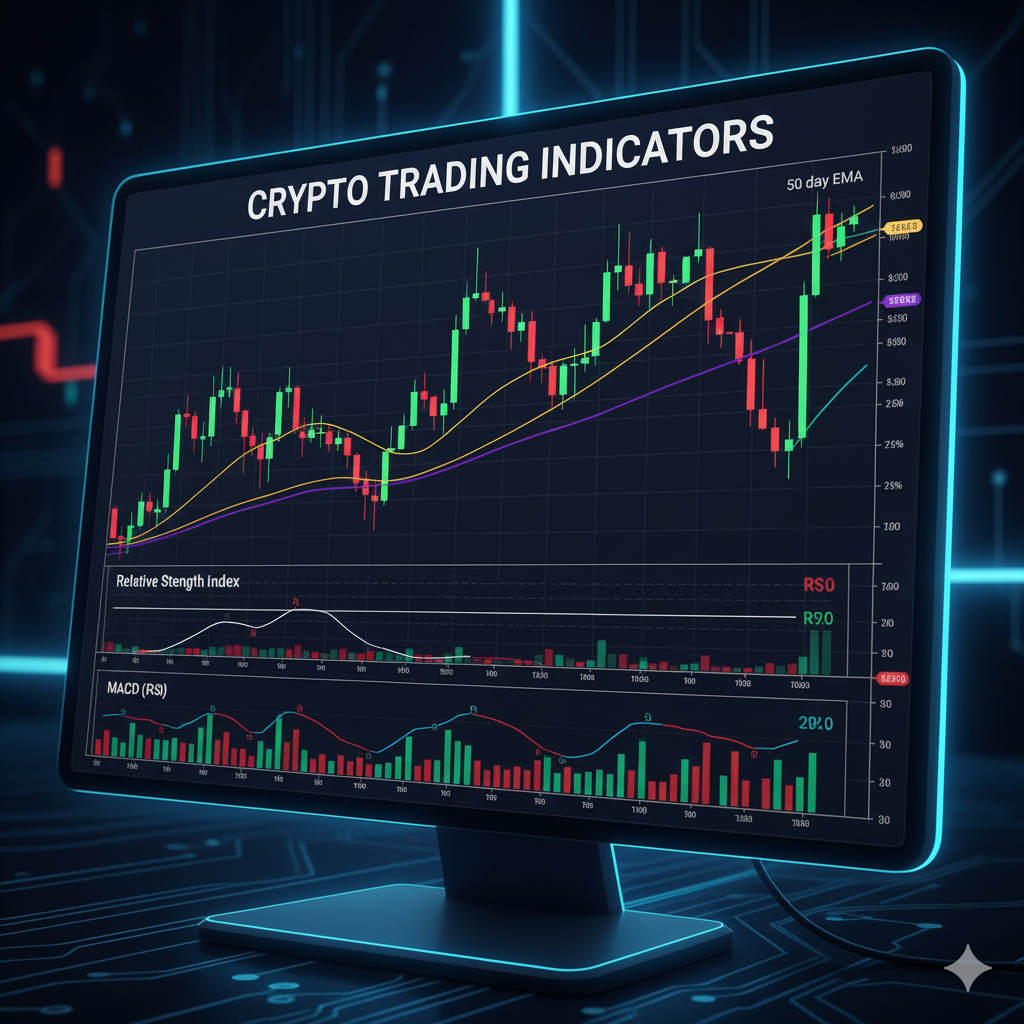
🚀 Unlock Trading Confidence: How to Use the Best Technical Indicators in Crypto

In the fast-paced world of cryptocurrency, timing is everything. Trying to navigate price charts without a roadmap is like sailing without a compass. Fortunately, technical analysis (TA) indicators are your compass, and learning to use the three most powerful ones—the RSI, MACD, and Moving Averages (MA)—is the key to smarter trading decisions.
This guide breaks down each indicator and, crucially, shows you how to combine them for higher-probability trades.
1. The Relative Strength Index (RSI): Your Momentum Meter
The Relative Strength Index (RSI) is a momentum oscillator that measures the speed and magnitude of recent price changes. It helps you determine if a cryptocurrency is being bought or sold too aggressively, signalling a potential reversal.
How to Read the RSI for Crypto Trading
The RSI is displayed on a scale from 0 to 100.
| RSI Zone | Indicator Status | Interpretation | Trading Signal |
| Above 70 | Overbought | Buying pressure is extended; a pullback is likely. | Potential Sell Signal |
| Below 30 | Oversold | Selling pressure is extended; a bounce is likely. | Potential Buy Signal |
| 50 Line | Neutral Midpoint | Crossing above 50 suggests bullish momentum; below suggests bearish. | Trend strength barometer. |
Advanced RSI: Divergence
A powerful signal occurs when the RSI and the price of the coin tell different stories. This is called divergence and often foreshadows a trend reversal:
- Bullish Divergence: The price makes a lower low, but the RSI makes a higher low. This is a strong hint that the downtrend is running out of steam—a prime buy opportunity.
- Bearish Divergence: The price makes a higher high, but the RSI makes a lower high. This warns that the uptrend is weakening and a drop may be imminent.
2. Moving Average Convergence Divergence (MACD): The Trend Confirmer
The Moving Average Convergence Divergence (MACD) is a trend-following momentum indicator that shows the relationship between two moving averages of a cryptocurrency’s price.
The MACD is composed of three parts:
- MACD Line: The difference between a short-term EMA (typically 12 periods) and a long-term EMA (typically 26 periods).
- Signal Line: A 9-period EMA of the MACD Line.
- Histogram: The visual difference between the MACD Line and the Signal Line.
Key MACD Trading Signals
- Signal Line Crossovers (The Primary Signal):
- Buy Signal: The MACD Line crosses above the Signal Line.
- Sell Signal: The MACD Line crosses below the Signal Line.
- Zero Line Crossovers (Trend Strength):
- Crossing above the zero line confirms stronger bullish momentum.
- Crossing below the zero line confirms stronger bearish momentum.
3. Moving Averages (MA): Charting the Trend Direction
Moving Averages (MA) are foundational tools that smooth out price action, filter out market “noise,” and clearly define the current trend.
The two most popular types in crypto trading are:
- Simple Moving Average (SMA): Calculates a straight average over a set period (e.g., the last 50 days).
- Exponential Moving Average (EMA): Gives more weight to recent prices, making it react faster to current market changes.
How to Use MAs in Your Strategy
- Identify the Trend: If the price is consistently above a rising MA (e.g., the 50-day EMA), the trend is up. If it’s below a falling MA, the trend is down.
- Dynamic Support and Resistance: Prices often bounce off major MAs. A 100-day or 200-day MA can act as a reliable zone of support during a bull run or resistance during a bear market.
- Major Crossover Signals:
- Golden Cross: The 50-day MA crosses above the 200-day MA (Major Bullish Signal).
- Death Cross: The 50-day MA crosses below the 200-day MA (Major Bearish Signal).
🧩 The Smart Way: Combining Indicators for Higher-Conviction Trades
Using indicators in isolation leads to false signals (or “whipsaws”). The professional approach is to combine tools that measure different aspects of the market to create a confluence of signals.
Here is a proven combination strategy for a “Buy the Dip” trade:
| Step | Indicator Used | Action | Signal Confirmation |
| 1. Establish the Trend | Moving Average (50 EMA) | Check the price is trading above the 50 EMA. | Trend is Bullish. |
| 2. Identify Oversold Conditions | RSI | Wait for the RSI to pull back and drop below 40 (or even 30). | Asset is oversold in an uptrend. |
| 3. Confirm Momentum Reversal | MACD | Wait for the MACD Line to cross abovethe Signal Line. | Upward momentum is resuming. |
| 4. Execute | — | Enter the trade once all three conditions align. | High-conviction entry point. |
Key Takeaway for Crypto Traders
By mastering and combining these fundamental crypto trading indicators, you can move past emotional trading and execute a more disciplined, profitable strategy.