
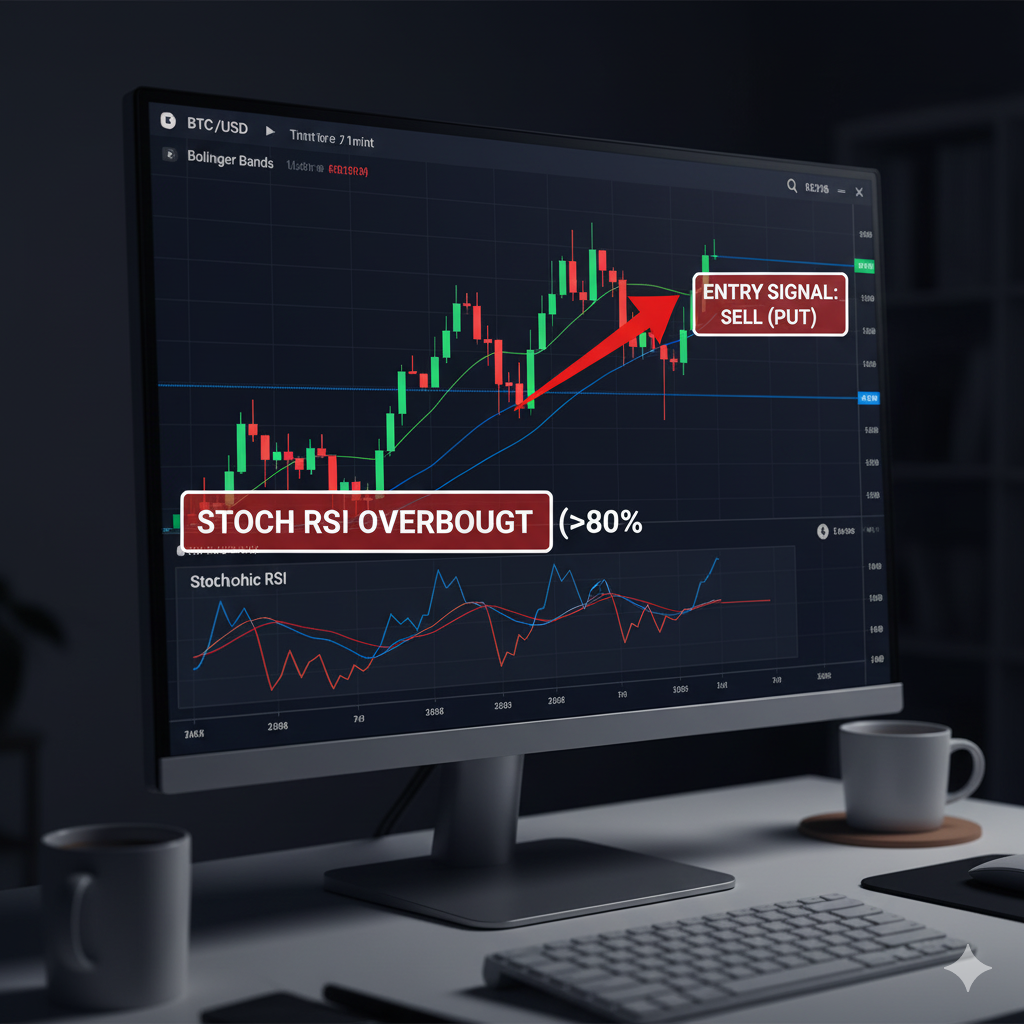
Trading binary options can be thrilling, offering rapid potential returns on short-term price movements. However, to consistently profit, traders need robust strategies built on reliable technical indicators. Today, we’re diving into a powerful combination: Bollinger Bands and the Stochastic RSI. This duo helps pinpoint high-probability reversal points, giving you a significant edge.
Why This Combination?
Individually, Bollinger Bands and the Stochastic RSI are excellent tools.
- Bollinger Bands (BB) measure market volatility and identify relatively high or low price levels. When the price touches or breaches the bands, it often signals a potential reversal back towards the mean.
- Stochastic RSI is a “derivative of a derivative,” applying the Stochastic Oscillator formula to the Relative Strength Index (RSI). This makes it highly sensitive to changes in momentum, quickly identifying overbought and oversold conditions with greater clarity than a standard RSI, especially on shorter timeframes.
The magic happens when you combine them. Bollinger Bands show where the price is relative to its average and volatility, while the Stochastic RSI tells you when momentum is exhausting, confirming that a reversal is genuinely probable.
The Strategy: Step-by-Step
This strategy is designed for short-term binary options, often on 1-minute or 5-minute charts, targeting quick reversals.
Key Indicators to Set Up:
- Bollinger Bands: (Standard settings often work, but some traders may experiment with tighter standard deviations on very short timeframes).
- Stochastic RSI: (Standard settings usually 14, 3, 3 are effective, but always test on your chosen asset and timeframe).
Scenario 1: Entering a PUT (Sell) Option
- Price Touches/Breaches Upper Bollinger Band:
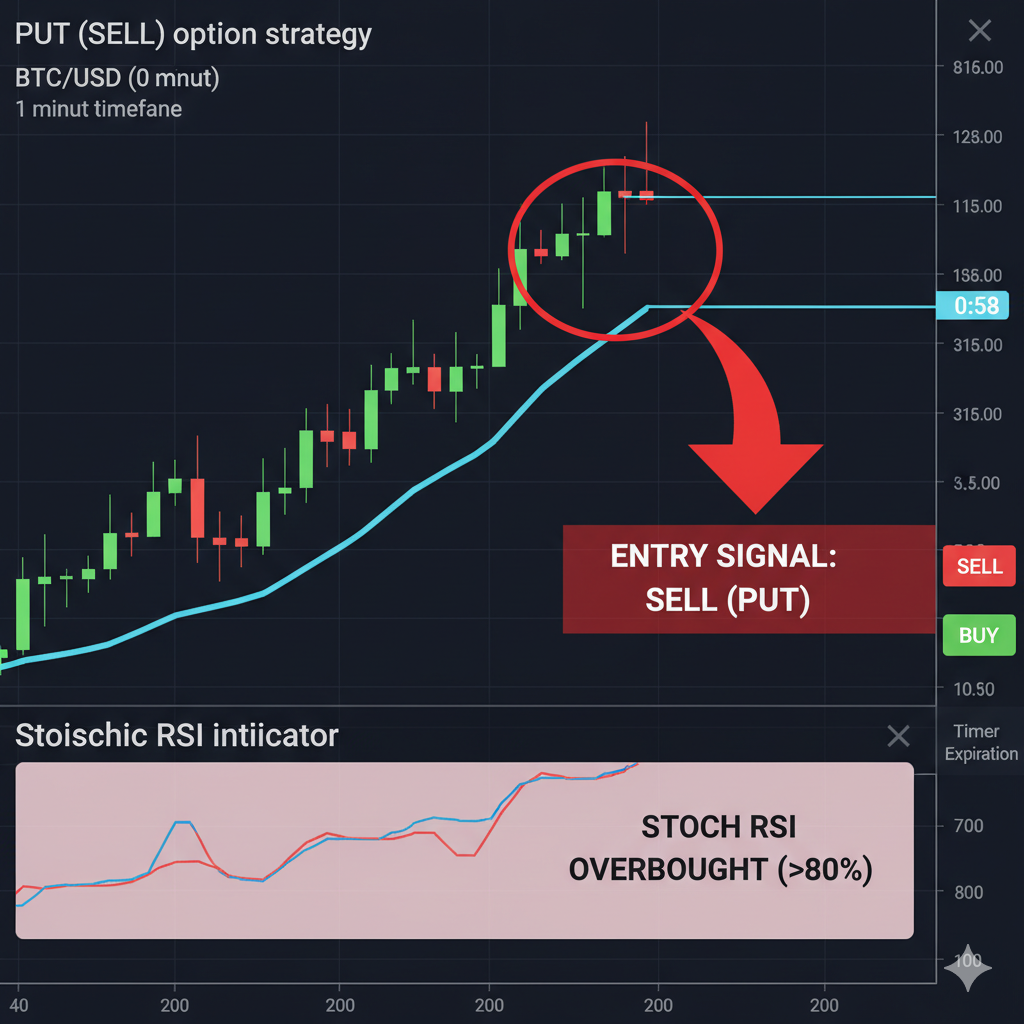
Look for the asset’s price candle to touch, close above, or significantly breach the upper Bollinger Band. This suggests the asset is entering an overextended or overbought state.
- Stochastic RSI Confirms Overbought: Simultaneously, observe the Stochastic RSI. It should be firmly in the overbought zone (typically above 80%). This confirms that bullish momentum is likely exhausted and a reversal is imminent.
- Entry Trigger: Once both conditions are met, prepare to enter a PUT (Sell) option. The ideal entry is often on the candle immediately following the confirmation, as the price starts to pull back from the upper band and the Stochastic RSI begins to hook downwards.
Scenario 2: Entering a CALL (Buy) Option
- Price Touches/Breaches Lower Bollinger Band:
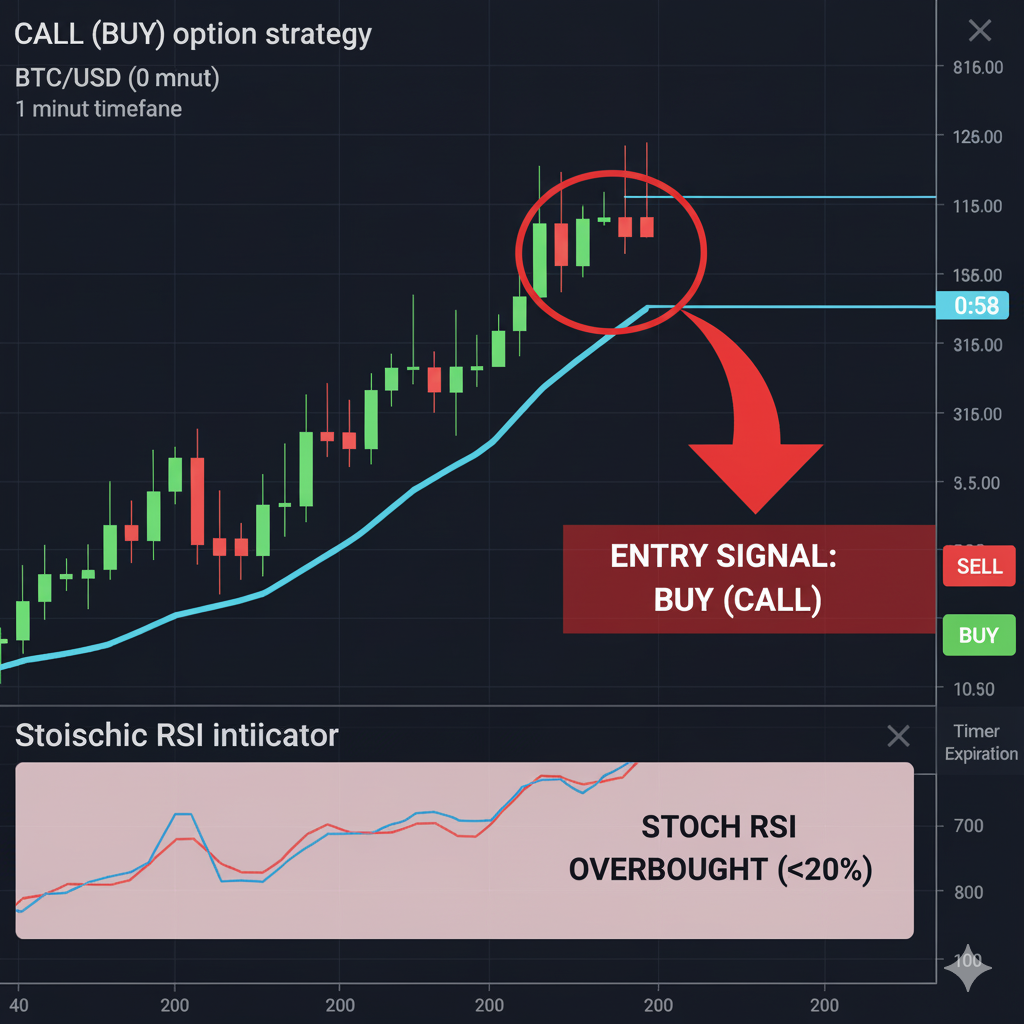
Watch for the asset’s price candle to touch, close below, or significantly breach the lower Bollinger Band. This indicates an oversold condition, suggesting the price might be due for an upward correction.
- Stochastic RSI Confirms Oversold: Check the Stochastic RSI. It should be deep in the oversold zone (typically below 20%). This reinforces the idea that bearish momentum is waning and a bounce is likely.
- Entry Trigger: With both conditions confirmed, prepare to enter a CALL (Buy) option. The entry is typically on the candle immediately after the confirmation, as the price starts to move up from the lower band and the Stochastic RSI hooks upwards.
Live Trading Example (as seen in the video)
In the video, a trade is demonstrated where:
- The price (BTC/USD on a 1-minute timeframe) pierced the upper Bollinger Band.
- Concurrently, the Stochastic RSI was well into the overbought territory.
- A PUT option was placed.
- The trade was profitable, illustrating the effectiveness of this combined signal for short-term reversals.
Important Considerations for Success
- Timeframes: This strategy is particularly effective on 1-minute and 5-minute charts for scalping-style binary options.
- Expiration Times: Match your binary option expiration time to your chart timeframe. For a 1-minute chart, 1-2 minute expirations are common. For a 5-minute chart, 5-10 minute expirations.
- Risk Management: Binary options carry high risk. Always use strict risk management, risking only a small percentage of your capital per trade.
- Practice on a Demo Account: Before trading with real money, thoroughly practice this strategy on a demo account until you are consistently profitable and comfortable with your entries and exits.
- Market Conditions: This strategy tends to work best in ranging or moderately trending markets, where price reversals are more common. In strongly trending markets, price can “walk the bands” for extended periods, leading to false signals.
- Volume: While not explicitly part of this specific strategy, always be aware of trading volume. Higher volume can add confidence to a signal.
Conclusion
The combination of Bollinger Bands and the Stochastic RSI provides a robust framework for identifying high-probability reversal points in binary options trading. By understanding how these indicators complement each other, you can sharpen your entry signals and enhance your trading accuracy. Remember, discipline, practice, and sound risk management are just as crucial as any indicator.
Happy trading!